Monitoring llama.cpp with Prometheus and Grafana...
An attempt that didn't quite make it
Introduction — Experiment small, dream big
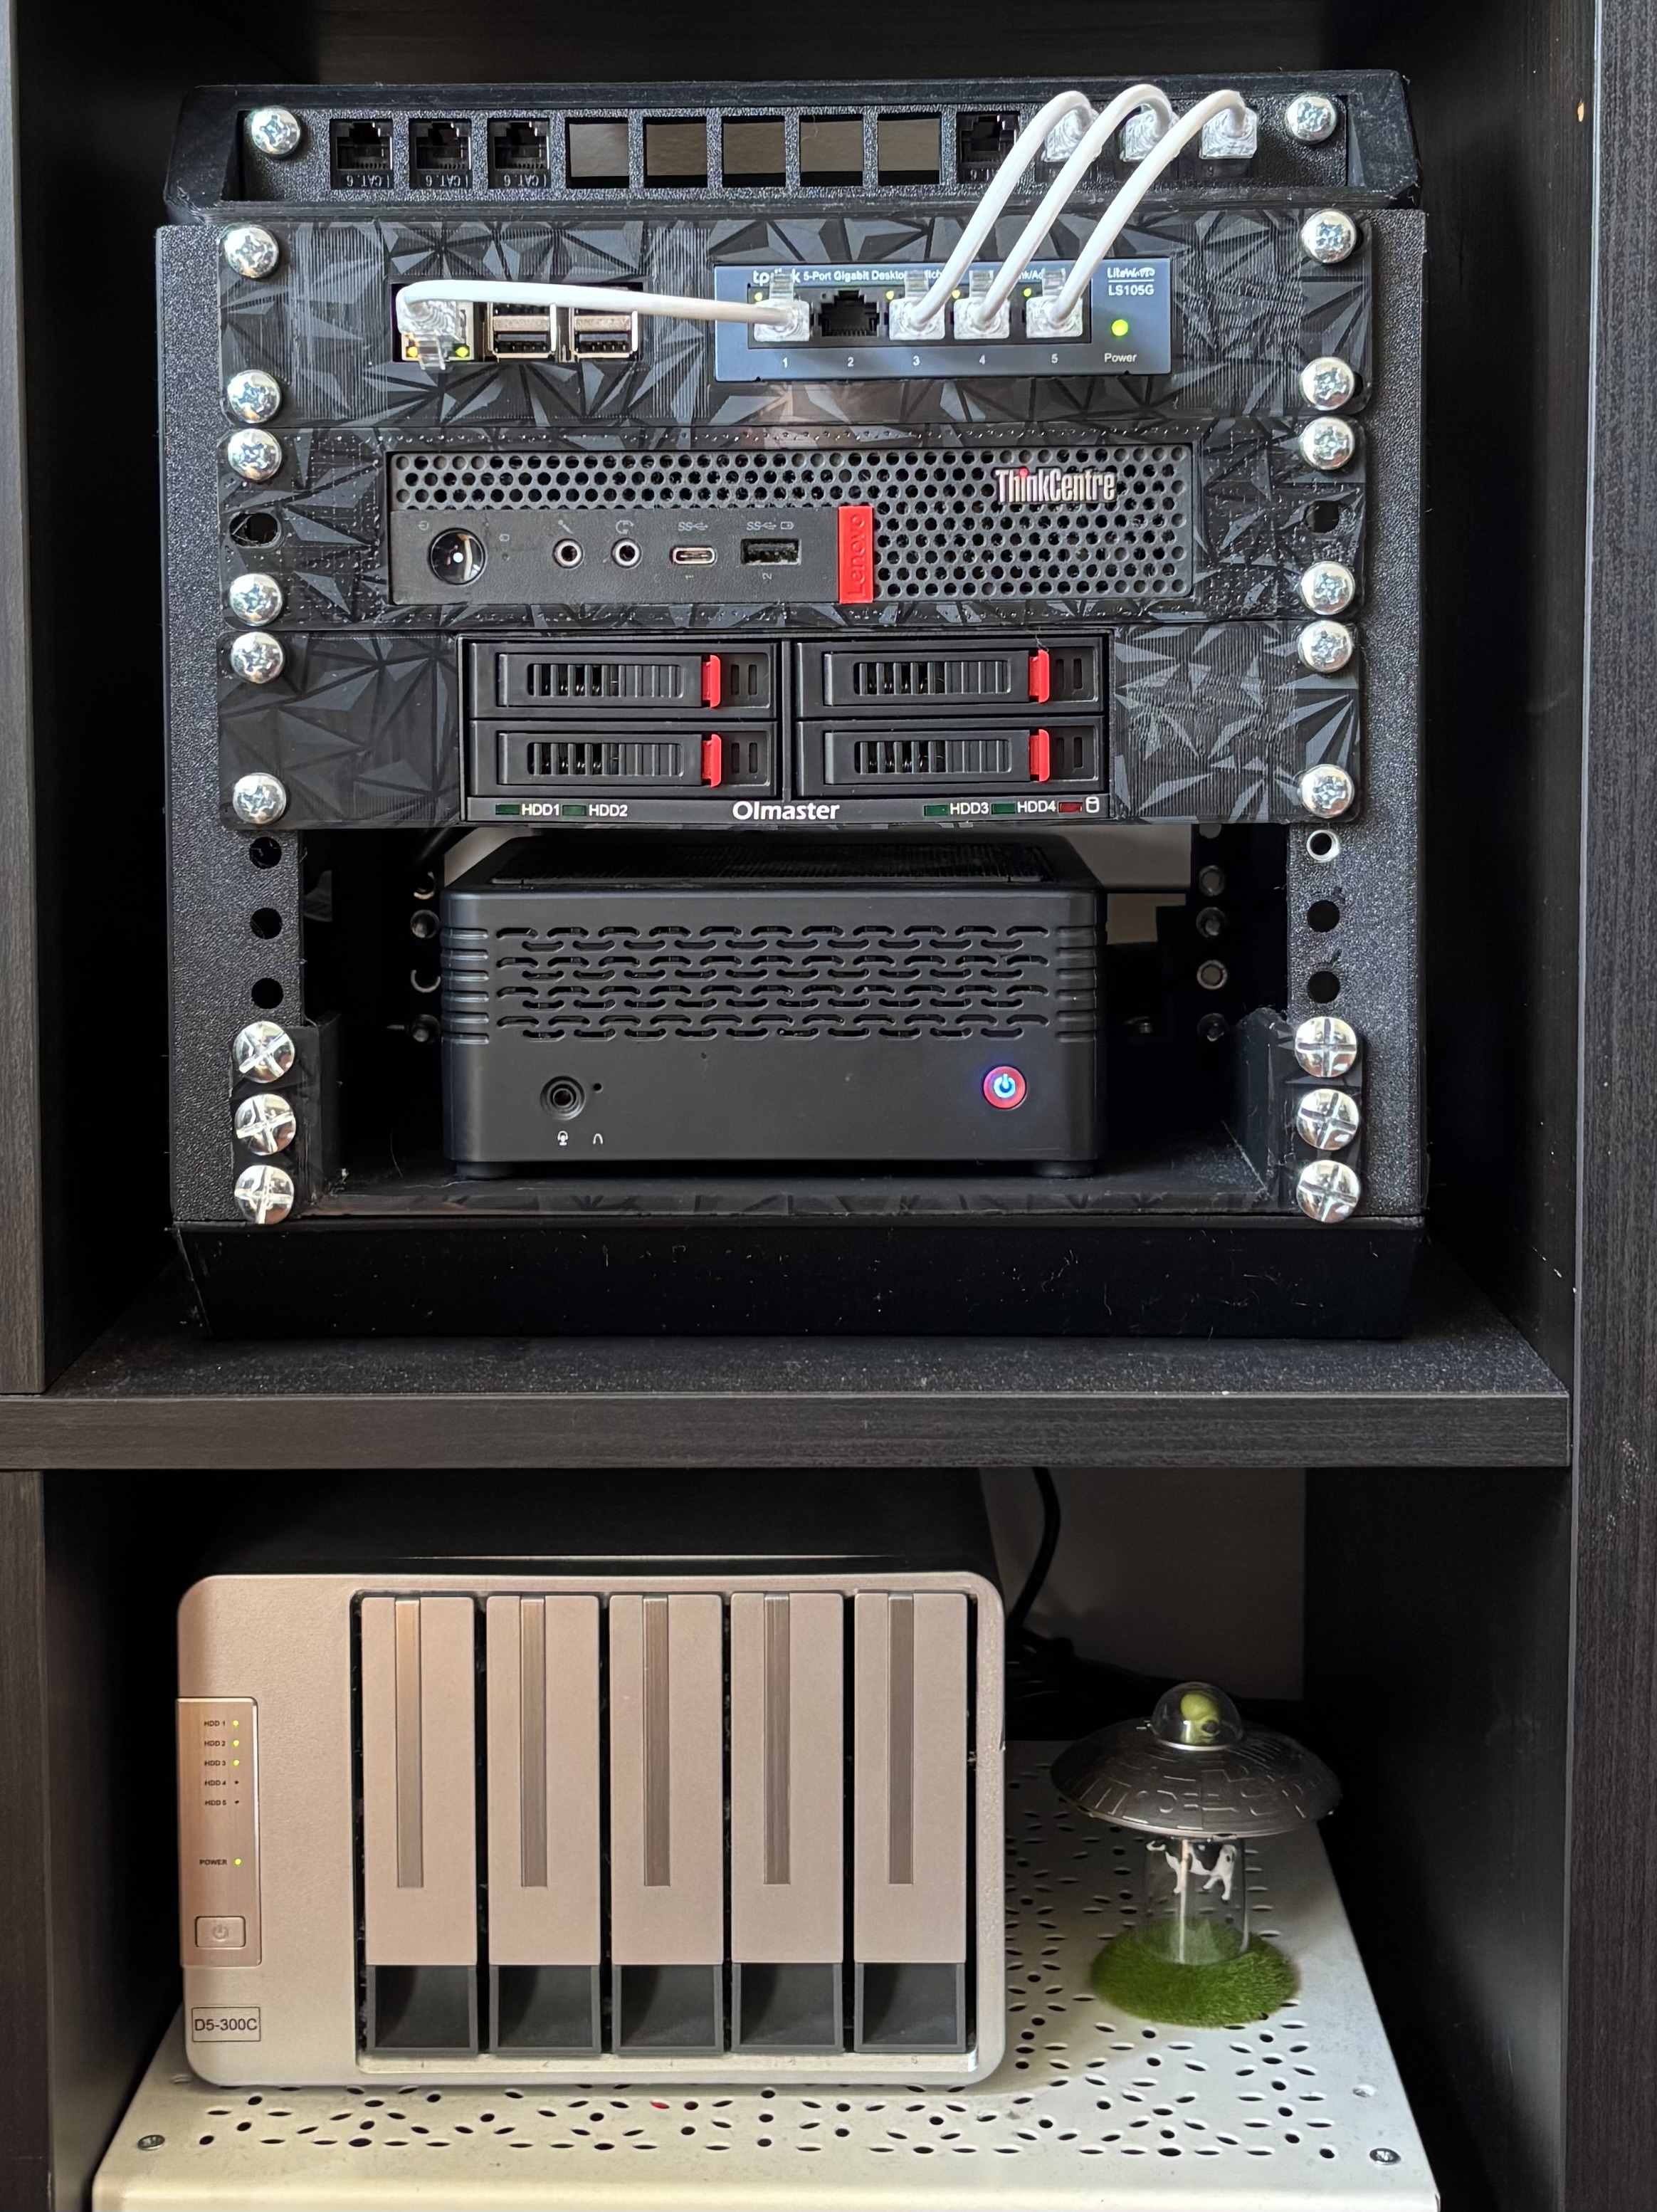
For the past few months, one of the mini PCs in my homelab has been getting a bit of a rough ride, or rather, it’s been pushed a little beyond what its original specs were meant for. I’m asking it to do things it was never designed for: load LLMs, process prompts, generate text, and analyze images. This is discrete GPU territory, but it doesn’t know that and keeps going anyway.
And yet, this little Minisforum X400 with its Ryzen 5 4650G Pro, 32GB of RAM, and its 7 CU integrated GPU manages not bad at all, all things considered. It’s no speed demon — to give you an idea, with Qwen3.6 35B A3B in 4-bit quantization it runs about 70-80 tokens per second on prefill and roughly 12 tokens per second on generation. Nothing to write home about, but it’s genuinely incredible to think that a machine like this can run a model with capabilities more than sufficient for small tasks in home automation, for example.
With a lightweight coding agent like pi and the magic of KV caching, small tasks are handled just fine. Even for more structured batch workflows — for instance, a couple of automations built with n8n to leverage the model’s multimodal capabilities — no problem at all, and it does its job admirably.
Obviously, given the limitations, it’s mostly useful for experimenting with configurations and infrastructure. It’s hard to find a concrete use case with someone on the other end of the screen willing to wait 30 seconds to five minutes for an answer. Yet the idea of having a small local inference server had been on my mind for a while, so I decided to use what I had on hand to get the setup and configuration in order, choose the most suitable backend, find the best configuration for a couple of models, and then move everything to a more performant machine once one was available.
One thing that particularly interests me about my setup is observability — the ability to monitor how system performance changes across different configurations, features, and models. In today’s landscape, where new models come out frequently and you have to juggle different types of speculative decoding, model quantization, cache quantization, and attention management, having the ability to observe the impact on performance and model quality of different configurations is essential: without data, you’re blind.
Observability and data are the key to making any decision in an informed way. Everything that isn’t backed by a number, a chart, or concrete evidence is just an impression. And as such, it can’t guide a technical decision-making process.
This post is the story of how I tried to make visible what happens inside llama.cpp. A story made of metrics, dashboards, Prometheus, Grafana — and of a bug that, at least for now, forced me to put everything on hold.
From llama-swap to llama.cpp
Until recently, I used llama-swap to manage models. For those unfamiliar, llama-swap is an abstraction layer on top of llama.cpp that lets you configure multiple models and automatically handles their loading and idle state based on incoming requests. All of this long before llama.cpp implemented its native router mode.
Llama-swap has one major strength: a web interface that shows the performance of every single request — tokens processed, prompt processing speed, generation speed, average times by percentile. All beautiful, all visible, all out of the box.
But it also has some limitations. The first: versioning. I never managed to figure out exactly which version of llama.cpp was included in the Docker images distributed by llama-swap. Sure, I could have built the image myself, but there was another, more substantial limitation: handling parallel requests on different models. Due to an implementation constraint, llama-swap can’t emulate llama.cpp’s native ability to handle multiple requests on different models simultaneously.
In my current setup, this isn’t a limitation, but as mentioned, this configuration is just the testbed for new hardware that’s already on the way, so I decided to move on and use llama.cpp directly. The goal was to get immediate access to the latest available versions, with clear version management this time and no intermediary layers adding potential complexity and single points of failure to the inference system. However, from the very start I missed the monitoring that llama-swap provided. Instead of having a convenient web dashboard to check, I was back to reading logs, trying to recover just a fraction of the same data I had before.
Prometheus, Grafana, and software certainly not yet Enterprise Ready
The Stack: Prometheus and Grafana
So I got to work, aiming to replicate what I had with llama-swap, but with standard tools. I wanted to avoid using another intermediary layer, like LiteLLM, to keep the system management and configuration as simple as possible. So I chose Prometheus for collection, Grafana for visualization, and a small Python script as glue between the two. Everything is documented in detail in this GitHub gist.
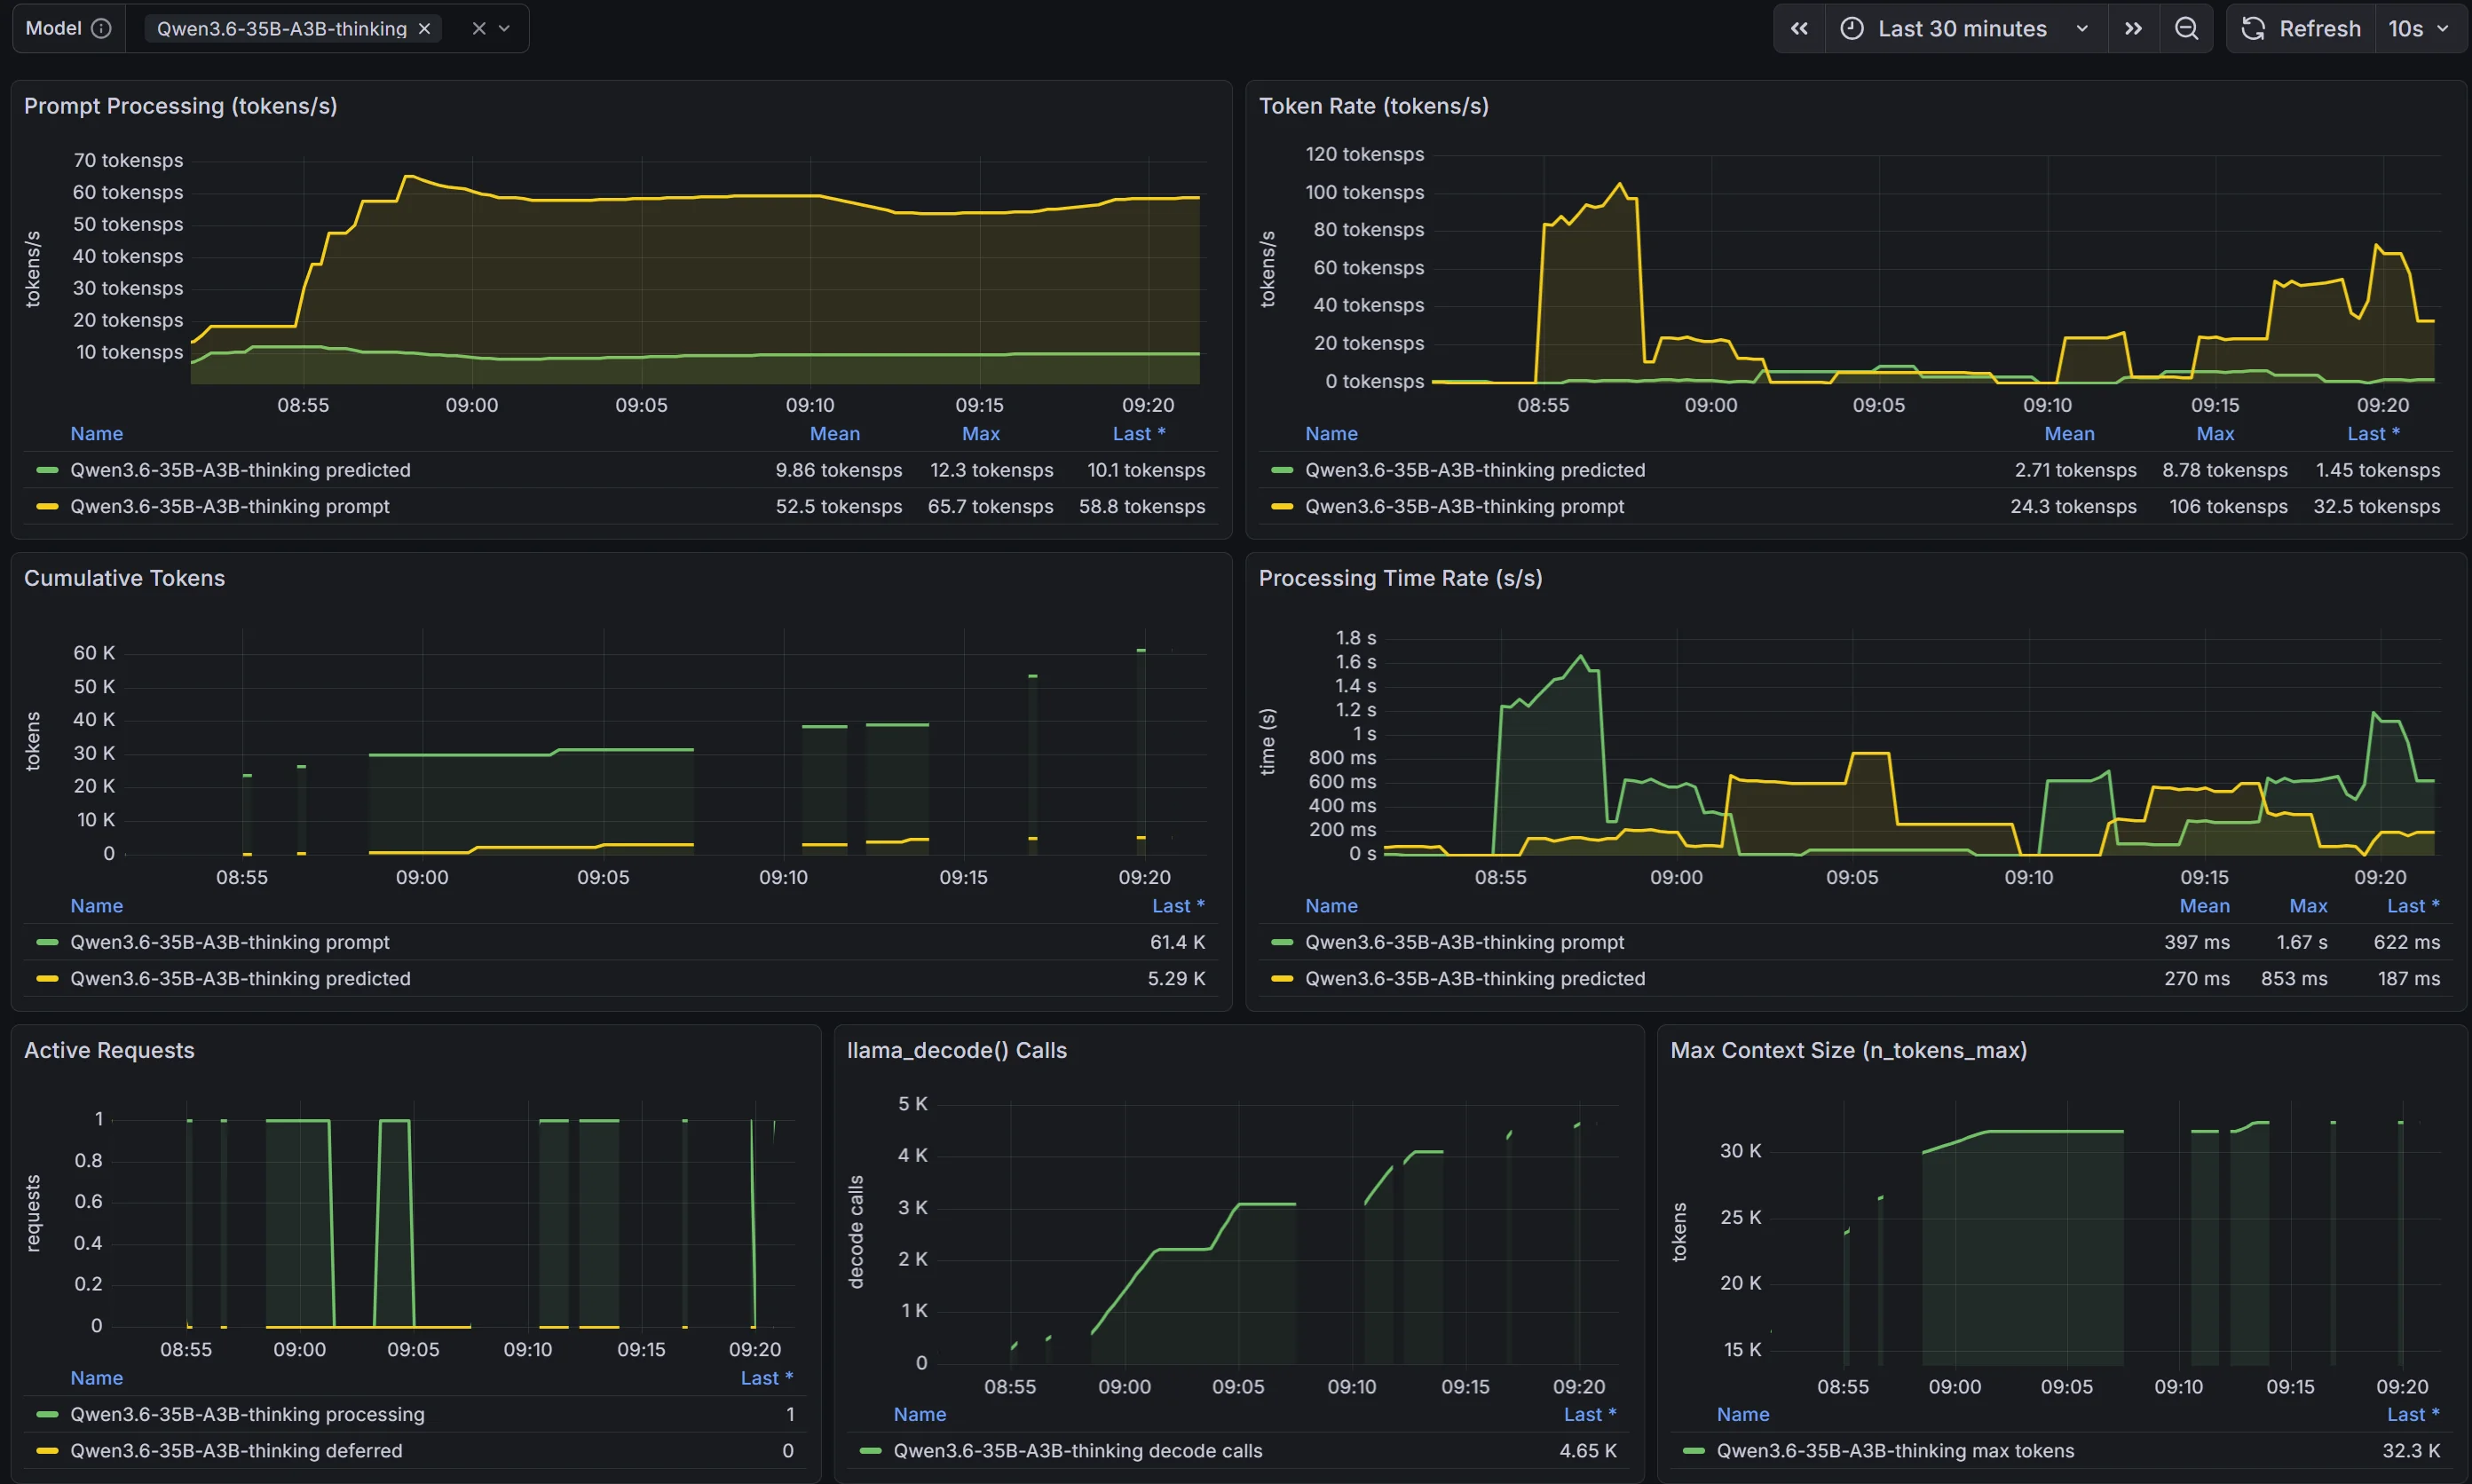
The final dashboard — at least in my intentions — was supposed to show:
- Prefill and generation speed trends per active model, with a per-model filter
- Tokens processed and cumulative processing time
- Currently active concurrent requests
- Models currently loaded in memory
The scraper problem
The first difficulty came right away. llama.cpp exposes a /metrics endpoint, but it needs to be called filtered by model. This means you can’t just point a vanilla Prometheus at that endpoint and expect it to work. An intermediary layer is needed — a dedicated scraper that handles the per-model filter logic.
Nothing insurmountable, but it was the first sign that the road wouldn’t be all downhill.
The bug that stopped everything
Unfortunately, after setting up the entire infrastructure — Prometheus collecting, Grafana visualizing, the dashboard finally coming to life — I hit a wall.
A known bug in llama.cpp related to metrics exposure prevents loaded models from entering idle state, blocking both power savings and runtime model switching based on requests, effectively making llama.cpp’s routing functions unusable.
In plain terms: every call to the /metrics endpoint resets the model’s keep-alive timer. llama.cpp thinks the model is still in use, and therefore doesn’t free memory when it could go idle.
The consequences are twofold, both painful:
- resource waste — the model stays in memory even when nobody is using it
- routing doesn’t work — if the loaded model is perceived as in use, llama.cpp won’t free it to make room for another model when a different request comes in
So for now, the solution is on hold. The dashboard is there, the data would be flowing, but I can’t give up the routing functionality.
Conclusion — even a defeat is data
Llama.cpp is a fantastic project, evolving at breakneck speed, but like any software in its growth phase, it has its cracks. I’ll keep my dashboard on the side for when the bug is fixed, when the new hardware arrives, or when I find a workaround. Probably, until then, I’ll rely on LiteLLM to monitor the performance and usage of the inference engine and its various models.
The full setup is documented in the gist — if anyone wants to follow the same path (or help find a fix for the bug), it’s all there.